Why choose Sitowise

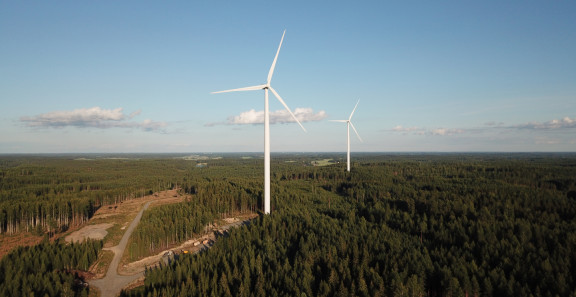
Locate solar and wind turbines in optimal positions
Locate compensation sites on the map
Have up-to-date maps and clear summary reports at your fingertips
The authorisation process will be speeded up as the project screening phase becomes more efficient. You will have access to more accurate information on the impact of land use chan

We provide renewable energy operators with up-to-date maps and summary reports based on artificial intelligence and satellite monitoring. Together with our baseline data, they streamline the project screening phase, which in turn speeds up the entire permitting process. They also help in reporting the impacts of projects.

More sustainable land use planning

Smart Analytics and Maps help to optimise the location of solar and wind farms (read more). In addition to the most suitable areas, the map shows the areas with the highest biodiversity or carbon sinks. By avoiding the siting of power plants in these areas, land use will become climate and environmentally sustainable. The same maps can also be used to identify the best compensation sites.

Advanced sustainability reporting will provide more accurate information on the impacts of land use change on carbon dioxide and biodiversity.

Intelligent map data from a single service

With Smart Analytics and Maps, you can access both open, permissioned and AI-enriched geospatial data sets as an interface directly from the cloud. The data is also available, for example, in our Louhi product.

Voimalinja auringonlaskussa

The AI datas we offer (WMS/WMTS/WFS interfaces)

  • Optimal locations for solar power plants
  • Forest growth and carbon balance on the map
  • Forest diversity Index
  • CO2 and biodiversity summaries for the planning areas